The Global Dashboard. A web based ‘Drill Anywhere’ Visual Reporting Application.
So you have all this data about what is being recycled, where and when and by whom. You now need a reporting application that allows you to quickly and easily analyze all this data. This is the Global Dashboard which is accessed through a simple URL link in any browser.
Upon entry the Dashboard will present the highest level data across all facilities worldwide over the last 6 months. ROMS has 3 levels of categorization for any given inventory item whether it be a laptop or some CAT5 cable. These are named Category, Sub Category and Template. Think Laptop, Dell then the laptop model. So, upon startup you will see data at the Category level across all facilities worldwide. If you are a recycler with many customers you would see the category level across all of your customers.
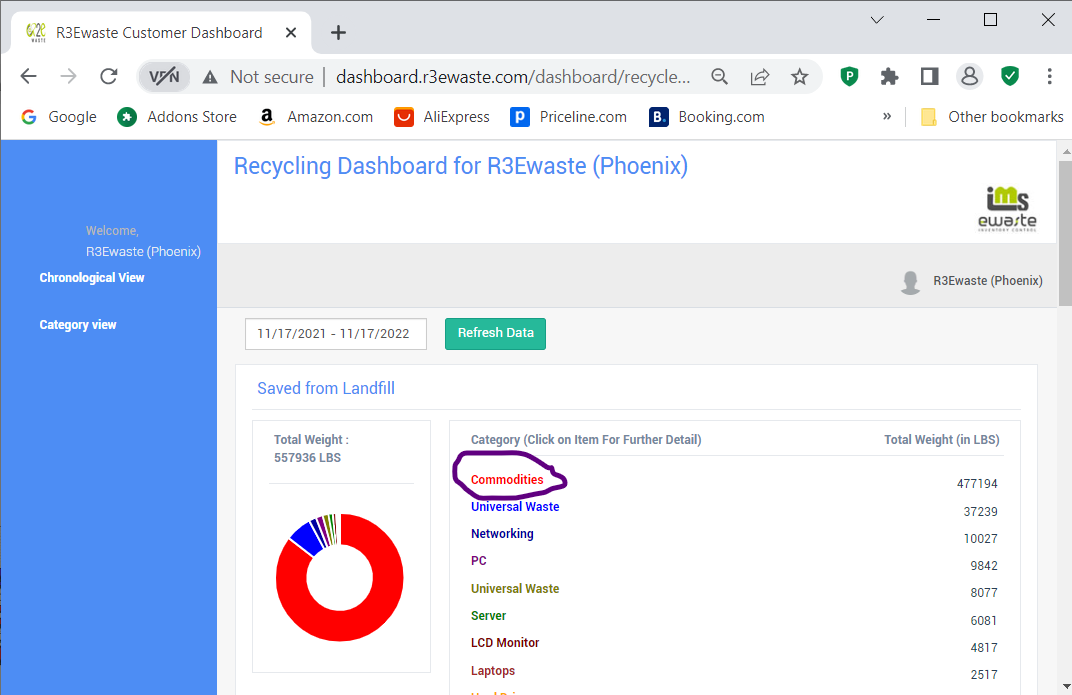
In the image to the right you can see the summary at the category level for a single facility. Should you have multiple facilities the total across all facilities would be displayed. These facilities would also be listed by region allowing you to drill into a region or multi-select facilities.
Clicking on the category ‘Commodities’ will drill down to the sub-category level.
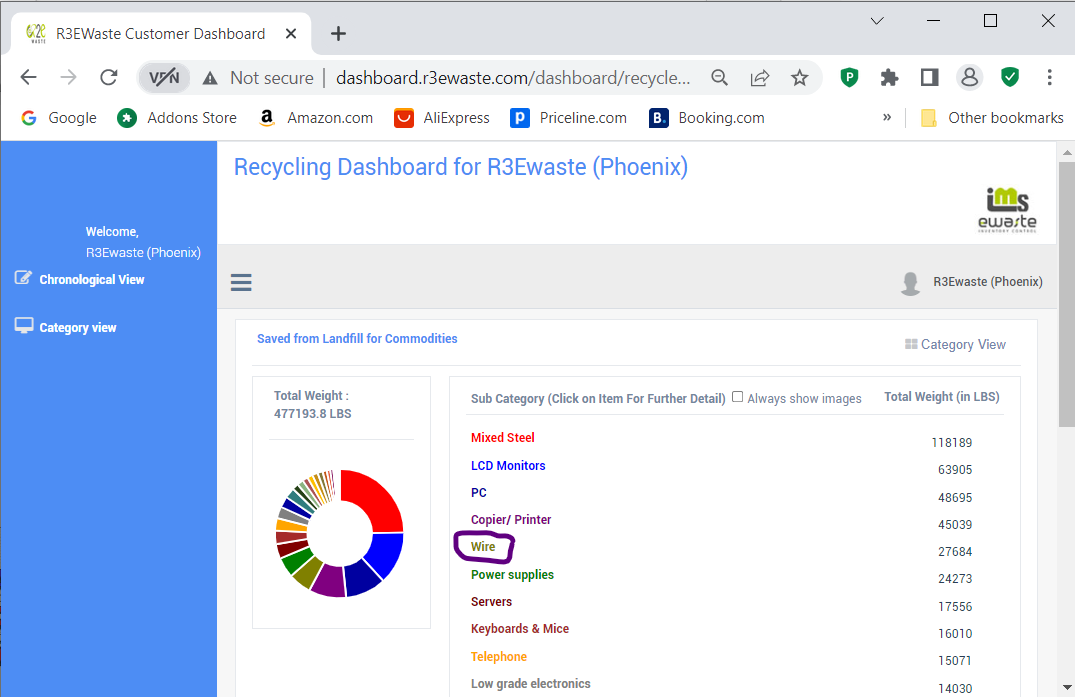
The image to the right is a screenshot at the sub-category level. At any point a user may switch to the raw data which can then be printed or exported to a range of formats. If ROMS is active a hyperlink will be shown for each row allowing the user to jump to the corresponding item record in ROMS.
By default the Dashboard will display input volumes. That is to say incoming material only. Below this (but not visible in the image) are the sales of items at the each level.
Clicking on the subcategory will take the user to the next level down, the Template layer. I have highlighted ‘Wire’ as an example.
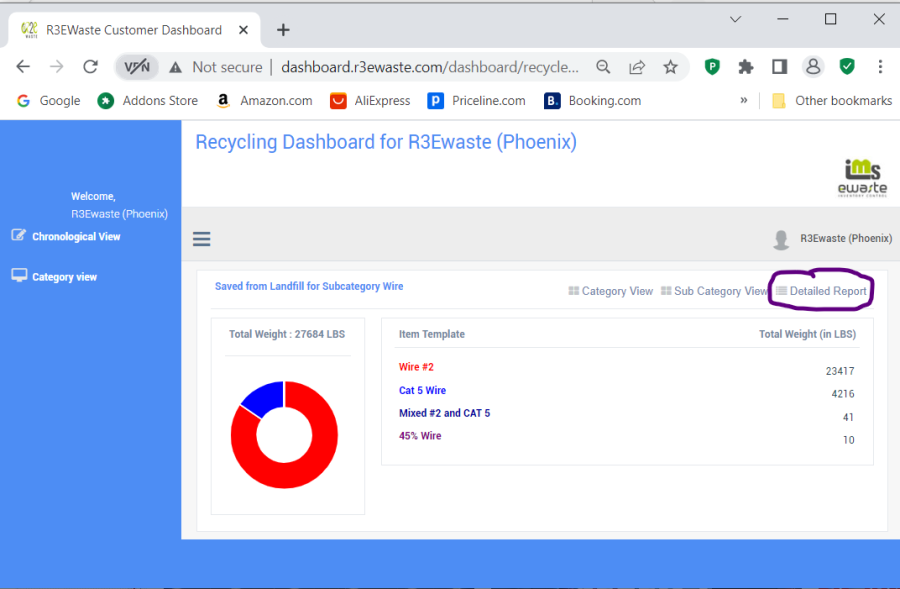
Now we are at the Template level where you can see the weights for each different type of wire. All data is in real time so, for example, if the Weights module was in use and 30 lbs of wire #2 were added to a scale, a refresh would immediately reflect the updated values.
Viewing the raw data at this level would also display hyperlinks to a bill of lading image should that item have been shipped.
I would like to emphasize that the images of the Dashboard displayed are at the simplest level. This is for a single facility processing Ewaste only. As multiple facilities are added within your Organization to ROMS these would automatically become visible within the Dashboard.
To get a complete demonstration of the full range of capabilities please email Graham@RecycleSoft.com or call 602 317 3981.
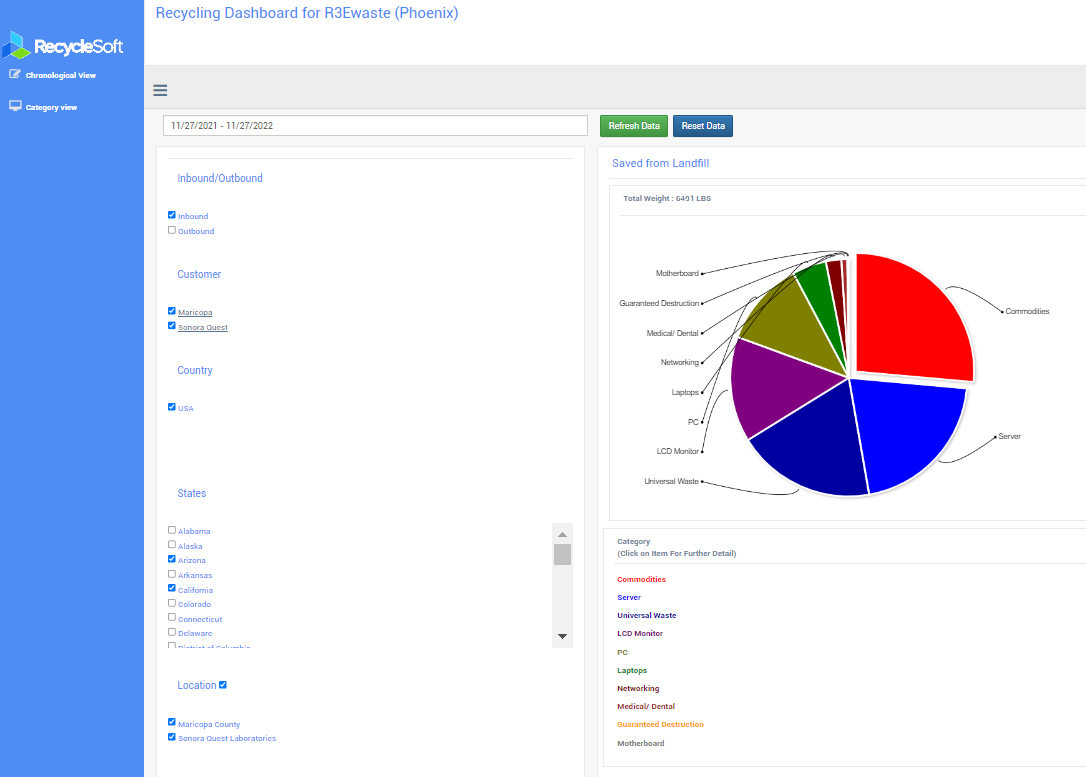
The image to the right shows the next level up. This is where a ‘Customer Group’ is used within ROMS. As a demonstration, R3Ewaste has added 2 of it’s customers to a named ‘Customer Group’. This will show R3Ewaste metrics across all customer groups. Clicking on a member will drill into only that member’s data. Even though there may be hundreds of customers this is a mechanism to provide specific customers with their own customized Dashboard.
Should any specific customer have multiple locations these would be listed and available as selectable variables. Should these be located in multiple States or Countries these would also appear as selectable variables.